San Jose Real Estate Market Reports
This is a real estate market activity report for Willow Glen in San Jose, CA. This report is comprised of data extracted from our local Multiple Listing Service (“MLS”) as of May 1, 2016. Willow Glen in San Jose is an MLS designated area which includes the 95125 zip code....
This is a real estate market activity report for Cambrian Park in San Jose, CA. This report is comprised of data extracted from our local Multiple Listing Service (“MLS”) as of May 1, 2016. Cambrian is an MLS designated area which includes the 95124 and 95118 zip codes. Single...
This is a real estate market activity report for Almaden Valley in San Jose, CA. This report is comprised of data extracted from our local Multiple Listing Service (“MLS”) as of May 1, 2016. Single Family Homes Market Report April 2016 56 Active Single Family Homes 44 Pending Sales (Under...
This is a real estate market activity report for Blossom Valley in San Jose, CA. This report is comprised of data extracted from our local Multiple Listing Service (“MLS”) as of May 1, 2016. Single Family Homes Market Report April 2016 50 Active Single Family Homes 79 Pending Sales (Under...
Colony Green Condos April 2016 Market Report Colony Green Market Activity for April 2016 There were six reported closed sales in the Colony Green Community in April 2016. The community is located in Blossom Valley in San Jose, CA. Number of “A Units” Sold: One Number of “B Units” Sold: One Number...
 Colony Green Condos March 2016 Market Report Colony Green Market Activity for March 2016 There were no reported closed sales in the Colony Green Community in March 2016. Inventory continues to be an issue for buyers. We continue to see multiple offers substantially over asking price. If you missed out...
Colony Green Condos February 2016 Market Report Colony Green Market Activity for February 2016 There was 1 reported closed sale in the Colony Green Condo Complex located in Blossom Valley San Jose in February 2016. “D Unit” Sold: This is an end unit which has 2 bedrooms, 2.5...
Colony Green Condos January 2016 Market Report Colony Green Market Activity for January 2016 There were 2 reported closed sales in the Colony Green Condo Complex located in Blossom Valley in January 2016. One “A Unit” Sold: This sale was an upstairs 2 bedrooms, 1 bathroom, 919 square...
Colony Green Condos March 2016 Market Report Colony Green Market Activity for March 2016 There were no reported closed sales in the Colony Green Community in March 2016. Inventory continues to be an issue for buyers. We continue to see multiple offers substantially over asking price. If you missed out...
Colony Green Condos February 2016 Market Report Colony Green Market Activity for February 2016 There was 1 reported closed sale in the Colony Green Condo Complex located in Blossom Valley San Jose in February 2016. “D Unit” Sold: This is an end unit which has 2 bedrooms, 2.5...
Colony Green Condos January 2016 Market Report Colony Green Market Activity for January 2016 There were 2 reported closed sales in the Colony Green Condo Complex located in Blossom Valley in January 2016. One “A Unit” Sold: This sale was an upstairs 2 bedrooms, 1 bathroom, 919 square...
 Blossom Valley Homes – 2011 Year End Market Report Week ending December 31, 2011 compared to January 1, 2011 There were 78 Blossom Valley Homes including short sales and bank owned homes for sale in the week ending December 31, 2011. There were 145 Blossom Valley homes, including...
 Almaden Homes – 2011 Year End Market Report Week ending December 31, 2011 compared to January 1, 2011 49 Almaden Homes, including short sales and bank owned homes for sale in the week ending December 31, 2011. 62 Almaden homes, including short sales and bank owned homes for sale...
 Cambrian Homes – Market Report Week ending December 3, 2011 compared to December 4, 2010 There were 92 Cambrian homes, including short sales and bank owned homes in the week ending December 3, 2011. There were 147 Cambrian homes, including short sales and bank owned homes in week ending...
 Blossom Valley Homes – Market Report Week ending December 3, 2011 compared to December 4, 2010 There were 93 Blossom Valley homes, including short sales and bank owned homes for sale in the week ending December 3, 2011. There were 159 Blossom Valley homes, including short sales and bank...
 Almaden Homes – Market Report Week ending December 3, 2011 compared to December 4, 2010 57 Almaden homes, including short sales and bank owned homes for sale in the week ending December 3, 2011. 95 Almaden homes, including short sales and bank owned homes for sale in the week...
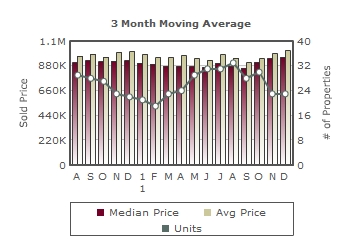
 Campbell Real Estate Market Report Week ending September 3, 2011 compared to September 4, 2010 The above graph shows the median price, the average price, and the number of properties sold. Prices are represented by the bars and sales are represented by the line. There were 125 Campbell homes,...
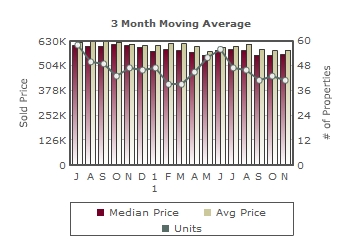
 Willow Glen Homes Market Report September 2011 Week ending September 3, 2011 compared to September 4, 2010 The graph above shows the median price, the average price, and the number of properties sold. Prices are represented by the bars while sales are represented by the line. There were 172...