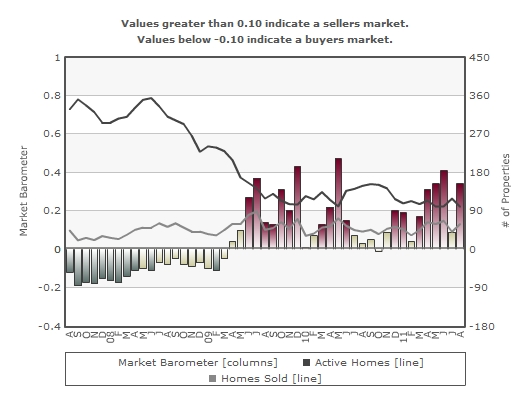
 Market Report Almaden Homes for Sale Week ending September 3, 2011 compared to September 4, 2010 The graph above shows the median price, the average price, and the number of properties sold. Prices are represented by the bars while sales are represented by the line. There were 88...
Market Report Almaden Homes for Sale Week ending September 3, 2011 compared to September 4, 2010 The graph above shows the median price, the average price, and the number of properties sold. Prices are represented by the bars while sales are represented by the line. There were 88...
Market Report Almaden Homes for Sale Week ending September 3, 2011 compared to September 4, 2010 The graph above shows the median price, the average price, and the number of properties sold. Prices are represented by the bars while sales are represented by the line. There were 88...
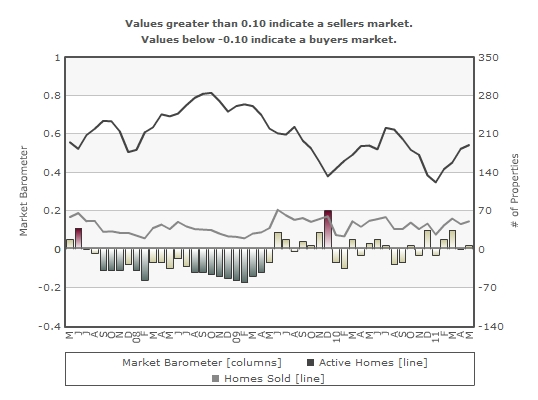
 Blossom Valley Real Estate Market Report Week ending September 3, 2011 compared to September 4, 2010 The graph above shows the median price, the average price, and the number of properties sold. Prices are represented by the bars while sales are represented by the line. There were 114...
 Willow Glen Homes Market Report July 2011 Week ending July 2, 2011 compared to July 3, 2010 There were 194 Willow Glen homes, including short sales and bank owned homes in the week ending July 2, 2011 compared to 201 Willow Glen homes, including short sales and bank owned...
 Campbell Homes Market Report Week ending July 2, 2011 compared to July 3, 2010 The above graph shows the median price, the average price, and the number of properties sold. Prices are represented by the bars and sales are represented by the line. There were 130 Campbell homes, including...
 Cambrian Homes Market Report Week ending July 2, 2011 compared to July 3, 2010 This graph shows the median price, the average price, and the number of properties sold. Prices are represented by the bars while sales are represented by the line. There were 139 Cambrian homes, including short...
 Blossom Valley Real Estate Market Report Week ending July 2, 2011 compared to July 3, 2010 The graph above shows the median price, the average price, and the number of properties sold. Prices are represented by the bars while sales are represented by the line. There were 128 Blossom...
 Almaden Homes – Market Report Week ending July 2, 2011 compared to July 3, 2010 The above graph shows the median price, the average price, and the number of properties sold. Prices are represented by the bars while sales are represented by the line. There were 114 Almaden homes,...
 Willow Glen Homes Market Report Week ending May 28, 2011 compared to May 29, 2010 There were 206 Willow Glen homes, including short sales and bank owned homes in the week ending May 28, 2011 compared to 200 Willow Glen homes, including short sales and bank owned homes in...
 I received an email message from Supervisor Yeager today advising of the good news to report. The motion to maintain Santa Clara County’s participation in the Proposition 90 program passed unanimously today, Tuesday, June 14, 2011. Supervisor Yeager is an advocate for seniors. He “supports Prop. 90 because it...
 Cambrian Homes Market Report Week ending May 28, 2011 compared to May 29, 2010 There were 142 Cambrian homes, including short sales and bank owned homes in the week ending May 28, 2011 compared to 127 Cambrian homes, including short sales and bank owned homes in week ending May...
 Blossom Valley Real Estate Market Report Week ending May 28, 2011 compared to May 29, 2010 There were 132 Blossom Valley homes, including short sales and bank owned homes in the week ending May 28, 2011 compared to 113 Blossom Valley homes, including short sales and bank owned homes...
 Almaden Homes Week ending May 28, 2011 compared to May 29, 2010 There were 104 Almaden homes, including short sales and bank owned homes in the week ending May 28, 2011 compared to 99 Almaden homes, including short sales and bank owned homes in week ending May 29,...